If you are asking what does the mean in math, the simple answer is this: the mean is the average of a set of numbers. You find it by adding all the values in the data set and dividing by the number of values. In statistics, the mean is one of the main measures of central tendency, along with the median and mode.
The mean is one of the first ideas students learn in arithmetic, data handling, and basic statistics. It helps turn a long list of numbers into one useful value that describes the center of the data.
You will see it in school grades, sports averages, business reports, science experiments, and survey results. In this guide, you will learn the mean definition, the formula, how to calculate it, when to use it, when it can be misleading, and how it compares with median, mode, range, weighted mean, and grouped data.
What does the mean in math mean?
In math, the mean is the same as the arithmetic mean or basic average. It is found by taking the sum or total of all numbers and dividing by the number of observations or values. Because it uses every number in the data set, the mean gives a broad picture of the center of the distribution.
You may also see the mean written with the symbol x̄ in statistics. This symbol is often used for a sample mean, while the Greek letter μ may be used for a population mean. For most school math problems, though, you only need to remember that mean means average.
Mean formula
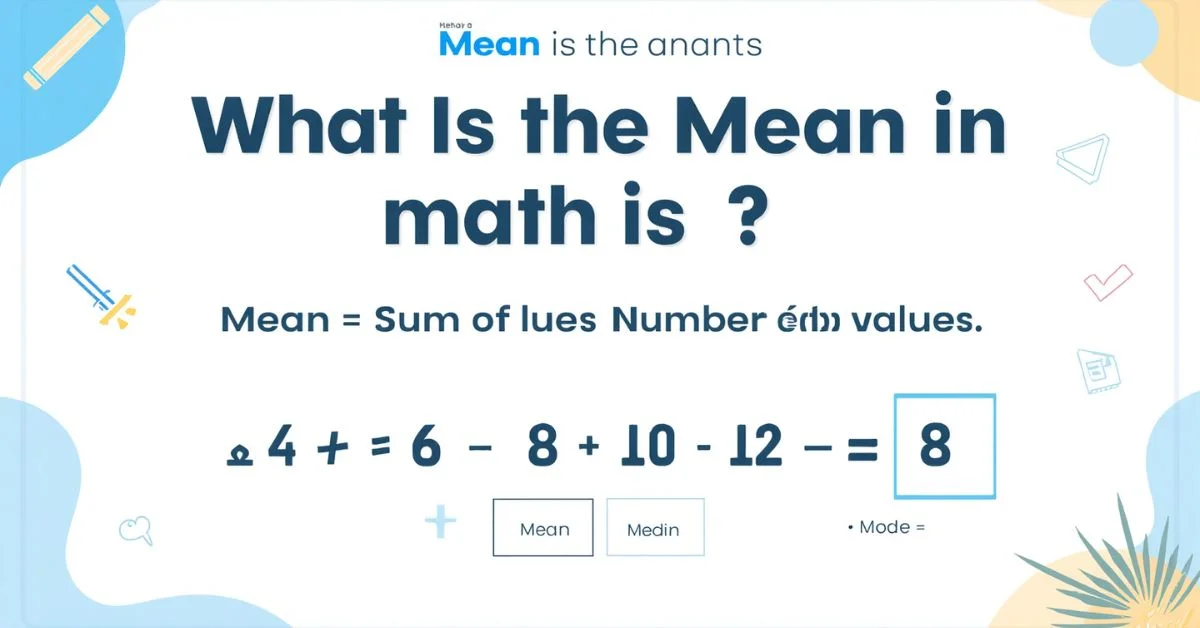
The formula is simple:
Mean = Sum of all values ÷ Number of values
You may also see it written like this:
x̄ = Σx / n
In this formula:
- Σx means add all the values together
- n means the number of values in the data set
This is the standard formula used for the arithmetic mean in basic math and descriptive statistics.
How to find the mean step by step
The easiest way to calculate the mean is to follow the same three steps every time.
Step 1: Add all the numbers
Find the total of the whole data set.
Step 2: Count how many values there are
This is the number of observations.
Step 3: Divide the total by the count
The answer you get is the mean.
This simple process is the same whether the numbers are positive, negative, whole numbers, or decimals.
Example 1: Whole numbers
Find the mean of:
4, 6, 8, 10, 12
Add them:
4 + 6 + 8 + 10 + 12 = 40
Count them:
There are 5 values.
Divide:
40 ÷ 5 = 8
So, the mean is 8.
Example 2: Decimals
Find the mean of:
2.5, 3.5, 4.0
Add them:
2.5 + 3.5 + 4.0 = 10
Count them:
There are 3 values.
Divide:
10 ÷ 3 = 3.33
So, the mean is about 3.33.
Example 3: Negative numbers
Find the mean of:
-2, 4, 6, 8
Add them:
-2 + 4 + 6 + 8 = 16
Count them:
There are 4 values.
Divide:
16 ÷ 4 = 4
So, the mean is 4.
Example 4: Fractions
Find the mean of:
1/2, 1/2, 1
Add them:
1/2 + 1/2 + 1 = 2
Count them:
There are 3 values.
Divide:
2 ÷ 3 = 2/3
So, the mean is 2/3.
Click To Read About This Post: What Does Product Mean in Math? Easy Guide with Examples
Mean in math examples from real life
The mean is useful because it appears in real situations, not just in textbooks.
School grades
If a student scores 70, 80, 90, and 60 on four quizzes, the total is 300. Divide by 4 and the mean score is 75. This is how average quiz or test scores are often reported when each task counts equally.
Sports statistics
A player’s average points per game is usually a mean. If a player scores 10, 15, 12, and 13 points in four games, the mean is 12.5 points.
Business and finance
Companies use the mean to track average sales, average customer orders, and average monthly costs.
Science and experiments
Researchers often use the mean to summarize repeated measurements because it uses all observations in a sample.
Mean vs median vs mode vs range
Students often mix these terms up, so it helps to compare them clearly.
| Term | Meaning | How to find it | Best use |
|---|---|---|---|
| Mean | The average | Add all values and divide by how many there are | Best for balanced data |
| Median | The middle value | Order the data and find the middle | Better when outliers exist |
| Mode | The most frequent value | Find the value that appears most often | Useful for repeated values |
| Range | Spread of data | Largest value minus smallest value | Shows how spread out data is |
The mean, median, and mode are all measures of central tendency, while the range helps describe variability or spread.
When the mean is the best average
The mean is usually the best average when:
- the data is fairly balanced
- there are no extreme outliers
- every value should affect the final answer
Because the mean uses every observation, it can be a very useful summary of the center of a data set.
When the median may be better
If one or two values are much higher or lower than the rest, the mean can get pulled away from the middle. In that case, the median may describe a more typical value. This is common with income, house prices, and other skewed distributions.
How outliers affect the mean
An outlier is a value that is very different from most other values in the data set. Outliers can have a big effect on the mean because the mean includes every value in the calculation.
Look at this data set:
5, 6, 7, 8, 100
Add them:
5 + 6 + 7 + 8 + 100 = 126
Now divide by 5:
126 ÷ 5 = 25.2
That answer is much higher than most of the numbers in the set. The outlier 100 pulls the mean upward. That is why statisticians often compare the mean with the median before describing a data distribution.
Weighted mean in math
A weighted mean is different from a regular mean. In a simple mean, every value counts equally. In a weighted mean, some values have more importance, or weight, than others.
Weighted mean formula
Weighted mean = Σ(wx) ÷ Σw
Here:
- x is the value
- w is the weight
Weighted mean example
Imagine a course grade where:
- Homework = 80 and counts 40%
- Exam = 90 and counts 60%
Weighted mean:
(80 × 0.4) + (90 × 0.6)
= 32 + 54
= 86
So, the weighted mean is 86.
Weighted mean is common in grading systems, finance, and data analysis because not every observation always carries the same importance.
Mean of grouped data
Sometimes data is not listed one value at a time. Instead, it is shown in a frequency table with class intervals. This is called grouped data. To estimate the mean of grouped data, you usually find the midpoint of each class, multiply it by the class frequency, add those products, and divide by the total frequency.
Example of grouped data idea
Suppose a table shows test scores grouped like this:
| Class interval | Frequency |
|---|---|
| 0–10 | 2 |
| 10–20 | 3 |
| 20–30 | 5 |
You would:
- Find each midpoint
- Multiply midpoint × frequency
- Add those totals
- Divide by total frequency
This gives an estimated mean, not an exact one, because grouped data uses class marks instead of every raw value.
Common mistakes when finding the mean
Many students understand the idea of average but still make small errors.
Forgetting to divide
Adding all the numbers is only the first step. You must divide by the number of values.
Dividing by the wrong number
You divide by how many values are in the data set, not by the biggest number or the sum.
Mixing up mean and median
The mean is not the middle number. The middle number is the median.
Ignoring outliers
If the data has an extreme value, the mean may not show a typical result.
Rounding too early
If your calculation gives a decimal, it is better to round at the end, not in the middle of the steps.
Practice questions on mean
These quick questions make the article more useful for learners and help cover the full intent behind this topic.
1. Find the mean of 3, 5, 7, 9
Total = 24
Count = 4
Mean = 6
2. Find the mean of 10, 10, 20, 20, 40
Total = 100
Count = 5
Mean = 20
3. Find the mean of 1.2, 2.8, 3.0
Total = 7
Count = 3
Mean = 2.33
4. A student’s five scores are 70, 75, 80, 85, 90. What is the mean?
Total = 400
Count = 5
Mean = 80
5. The mean of 4, 6, x is 8. What is x?
(4 + 6 + x) ÷ 3 = 8
10 + x = 24
x = 14
That last example is helpful because many students also search for missing-number mean problems, not just the definition.
Why the mean matters in statistics
The mean matters because it gives one number that summarizes a whole sample or population. It is widely used in descriptive statistics, data analysis, classroom math, business reports, and scientific research. But it should not be used blindly.
Smart analysis also checks the distribution, spread, and presence of outliers before deciding whether the mean is the best summary.
Final answer:
The mean in math means the average of a set of numbers. You calculate it by adding all the values in a data set and dividing by the number of values. It is one of the most important measures of central tendency and is often used with median, mode, range, outliers, weighted mean, and grouped data to understand numbers more clearly.
Read Also This Post: What Does LG Mean? Text, Brand, and Full Form Explained

Hello! I’m Clara Lexis, creator of Meanpedia.com. I specialize in breaking down words, phrases, and idioms so that anyone can understand and enjoy the beauty of English. My goal? Making language approachable, fun, and meaningful, one word at a time.